Gallery
A few more visual code side projects and doodles. More listed on the side projects page.

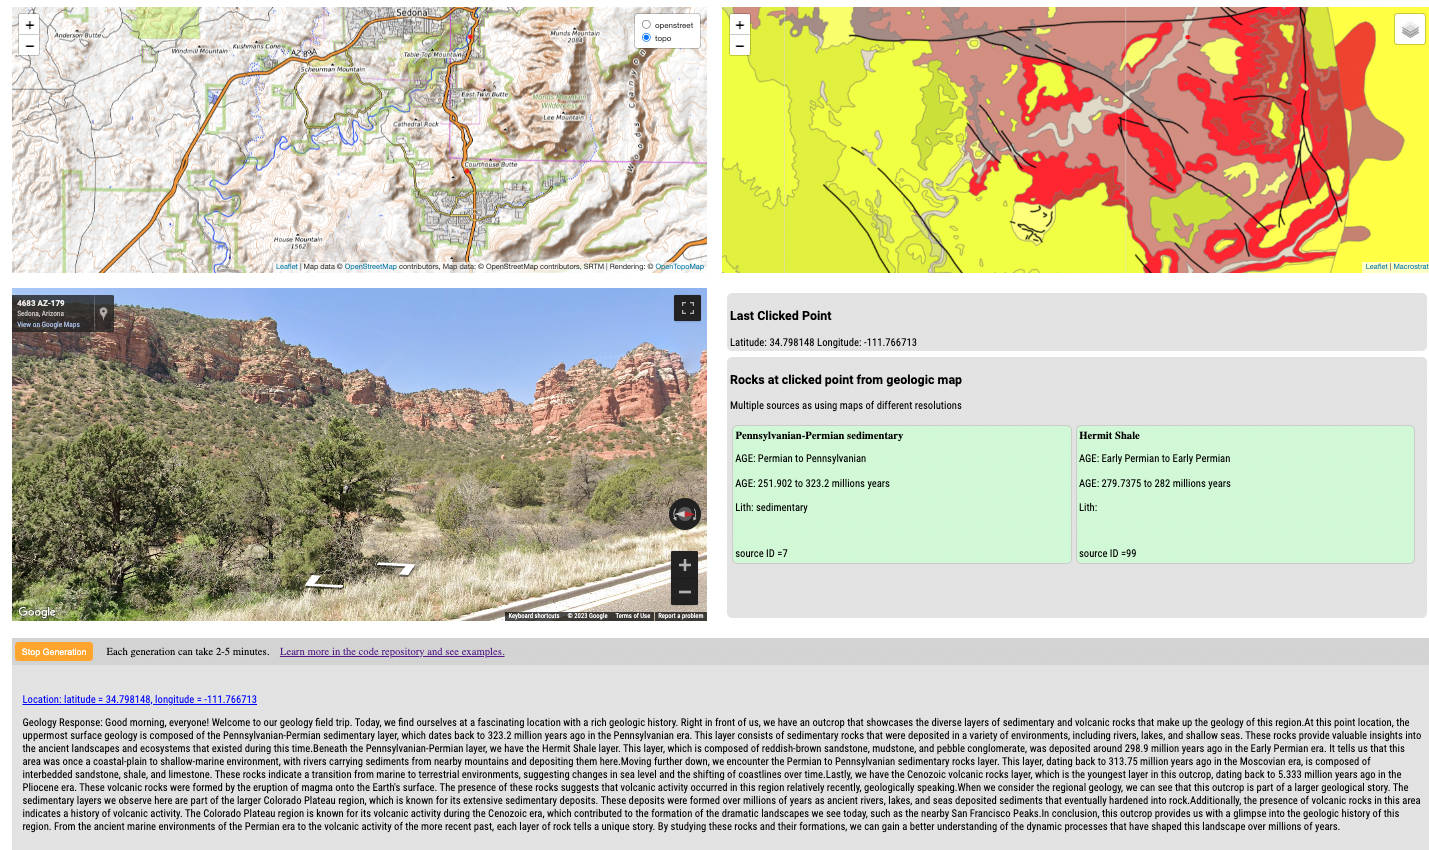
LAGDAL
Type: Website
Tools: leaflet.js, openAI, LLM, python, wikipedia, langchain, jupyter, requests, click, Flask
LLM Assisted Geology Descriptions of Arbitrary Locations = LAGDAL. Front-end and back-end website deployed on Azure that uses geologic map API data from Macrostrat and series of prompts sent to openAI to generate geologic field trip descriptions globally.
Learn more →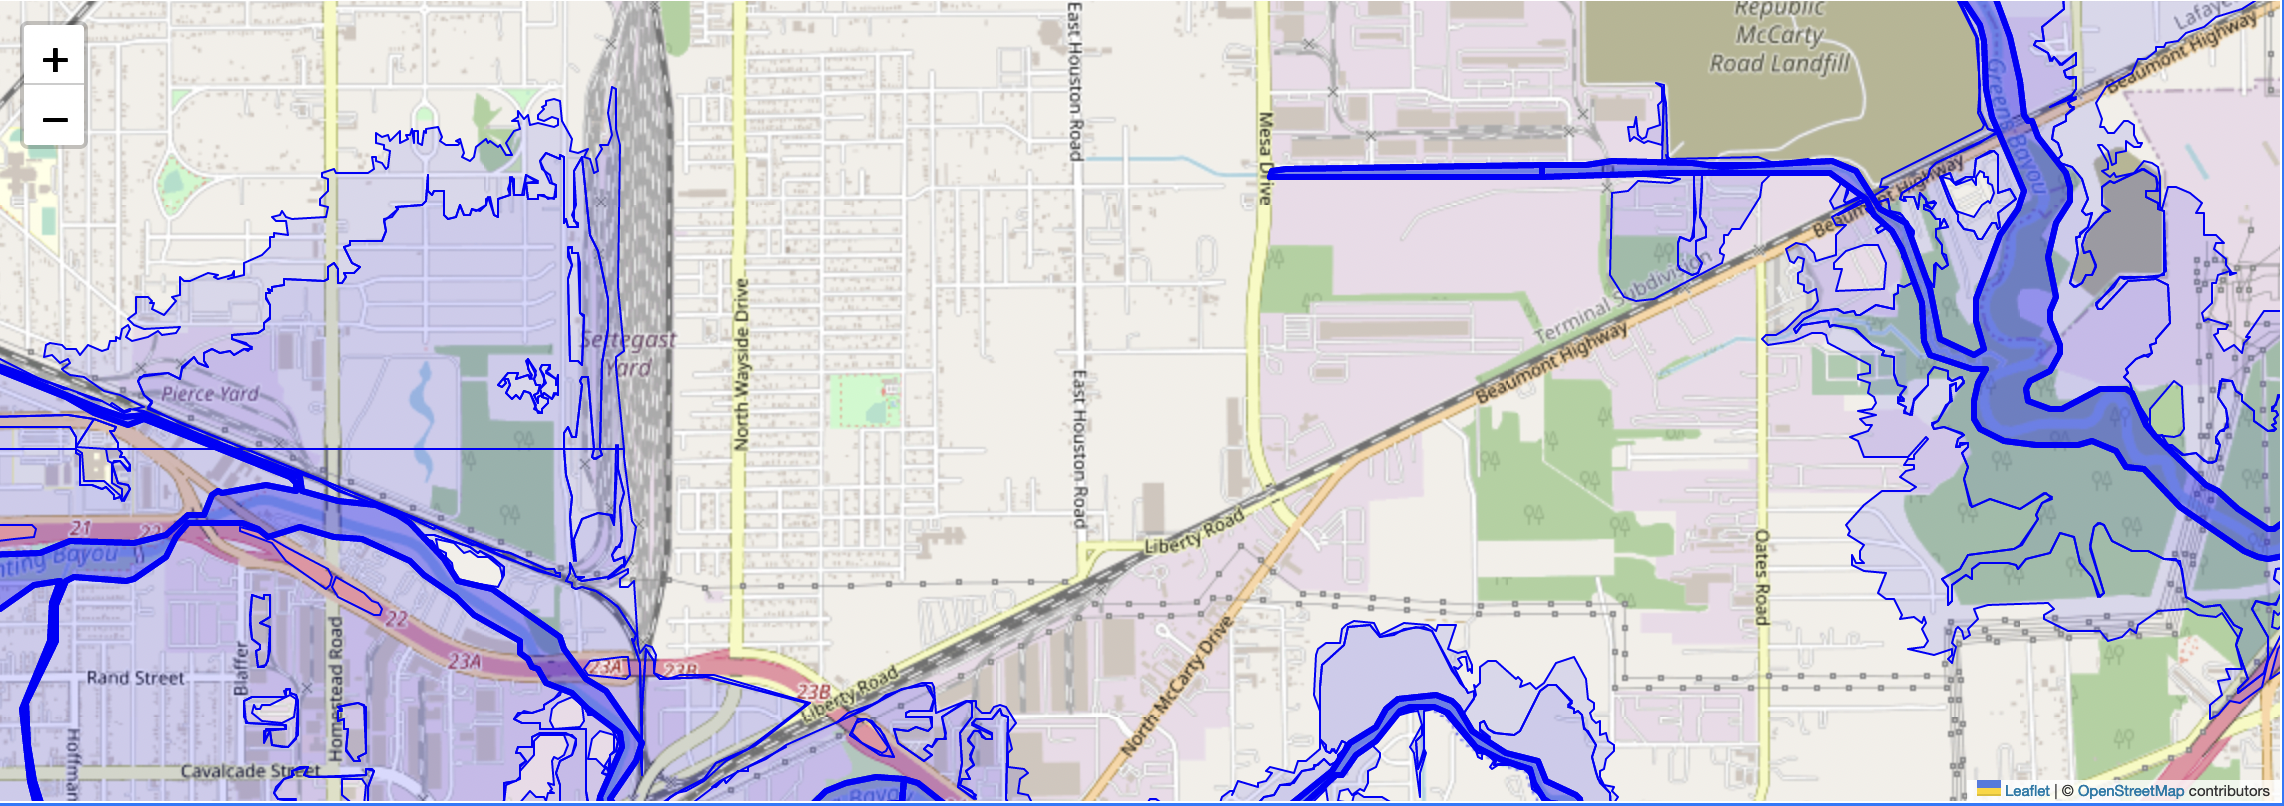
Maps that speak
Type: Website with speech
Tools: leaflet.js, Nosleep.js, turf.js
Built website that can stay open while driving or biking and tells you when you have entered or exited a flood plain in Harris County, Texas as January 2023 Houston Hackathon. Playing around with different ways to experience map data to make it more real and tied to a place.
Learn more →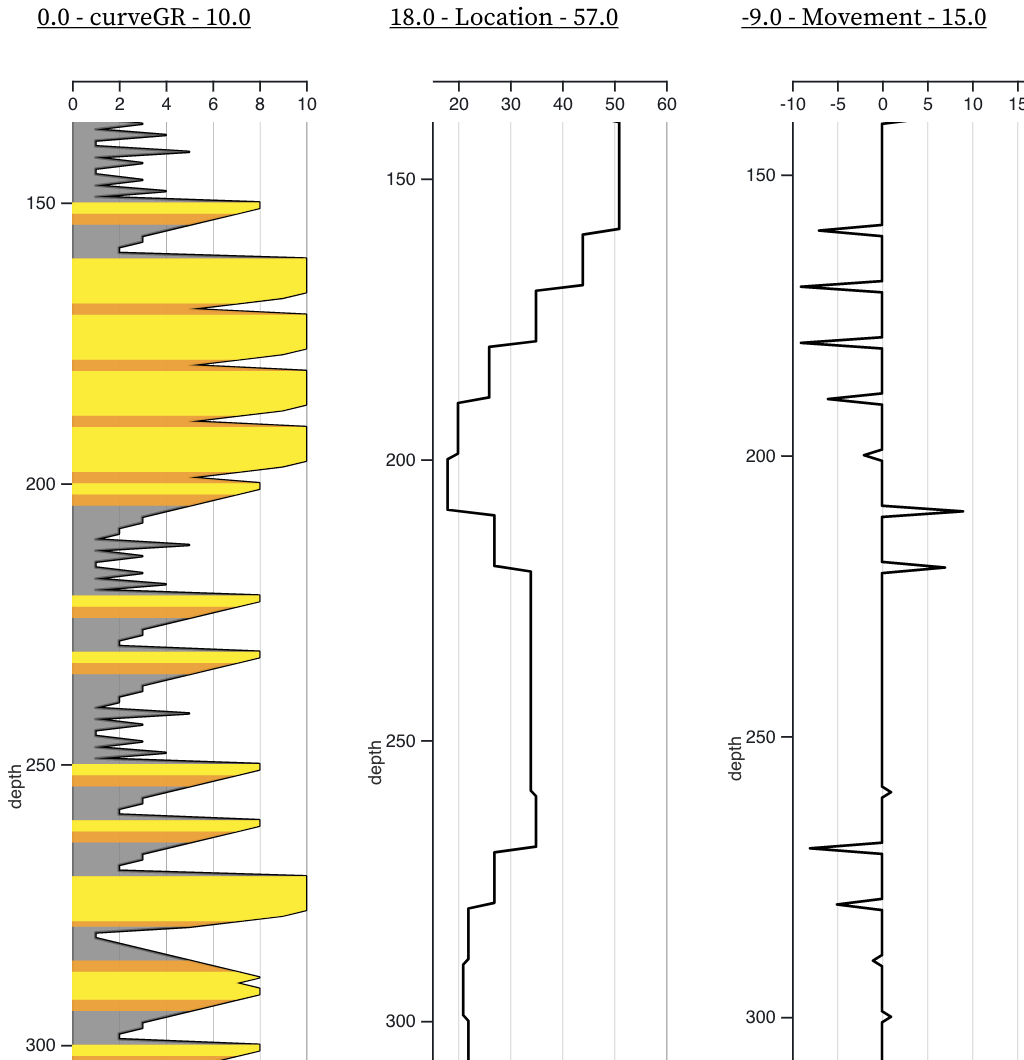
Stratigraphy vs. Sea Level Interactive Model
Type: Explorable Explanation
Tools: Observable, Vega.js, Wellioviz.js
A weekend code doodle where I explored building an explorable explainable for stratigraphic stacking patterns controlled by sea level. Hope to come back to this at some point and polish it up.
Learn more →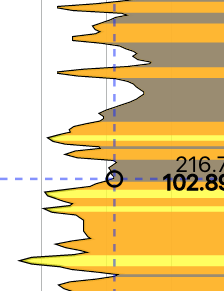
Wellioviz.js
Type: JavaScript Library
Tools: D3.js, wellio.js
Wellioviz.js was originally created as I was annoyed that there wasn't a way to visualize well logs on the web without downloading the files and converting them locally from government sites. It leverages d3.js and wellio.js.
Learn more →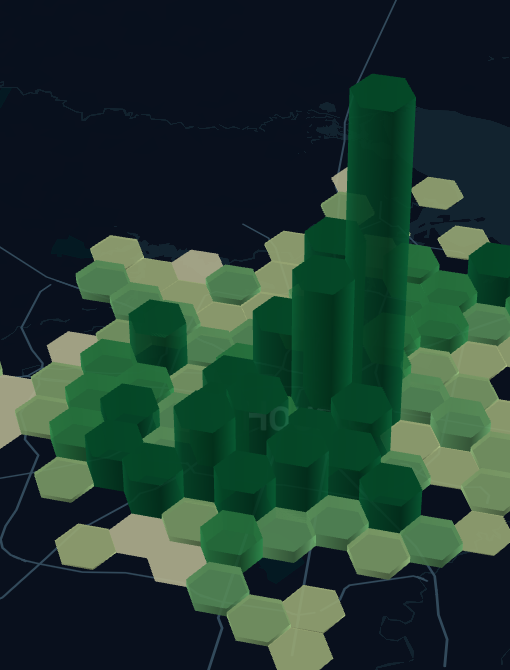
Houston: Art City / Science City
Type: Weekend Hackathon
Tools: Kepler.gl, Tableau, Web Scraping, JavaScript, Pandas
Texas arts organization Glasstire sponsored a weekend hackathon. I combined their dataset of art events with my scraped dataset of science related job advertisements to compare spatial distributions.
Learn more →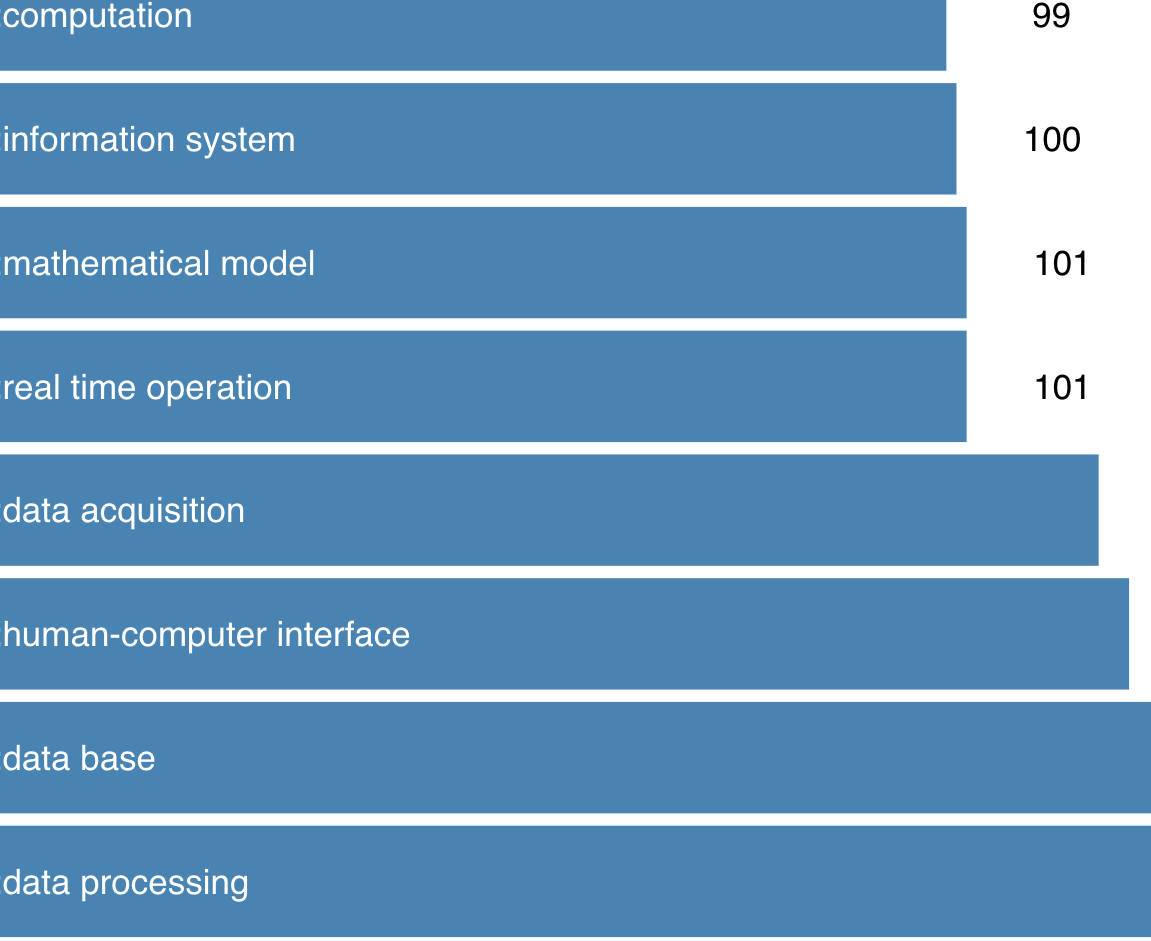
Machine Learning vs. Human Generated Keywords
Type: Observable Notebook
Tools: Observable, D3.js, Python, Natural Language Processing
Quick notebook to explore the differences between machine learning and human generated keywords.
Learn more →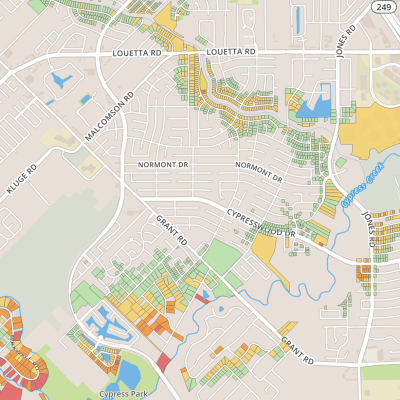
Modeled Flood Damage Dashboard
Type: Tableau, Maps
Tools: GeoPandas, Tableau
Exploration of different ways to represent the intersection of FEMA modeled damage from Hurricane Harvey in Houston and real estate value from Harris County Appraisal District. Helping out with SketchCity a local civic tech group.
Learn more →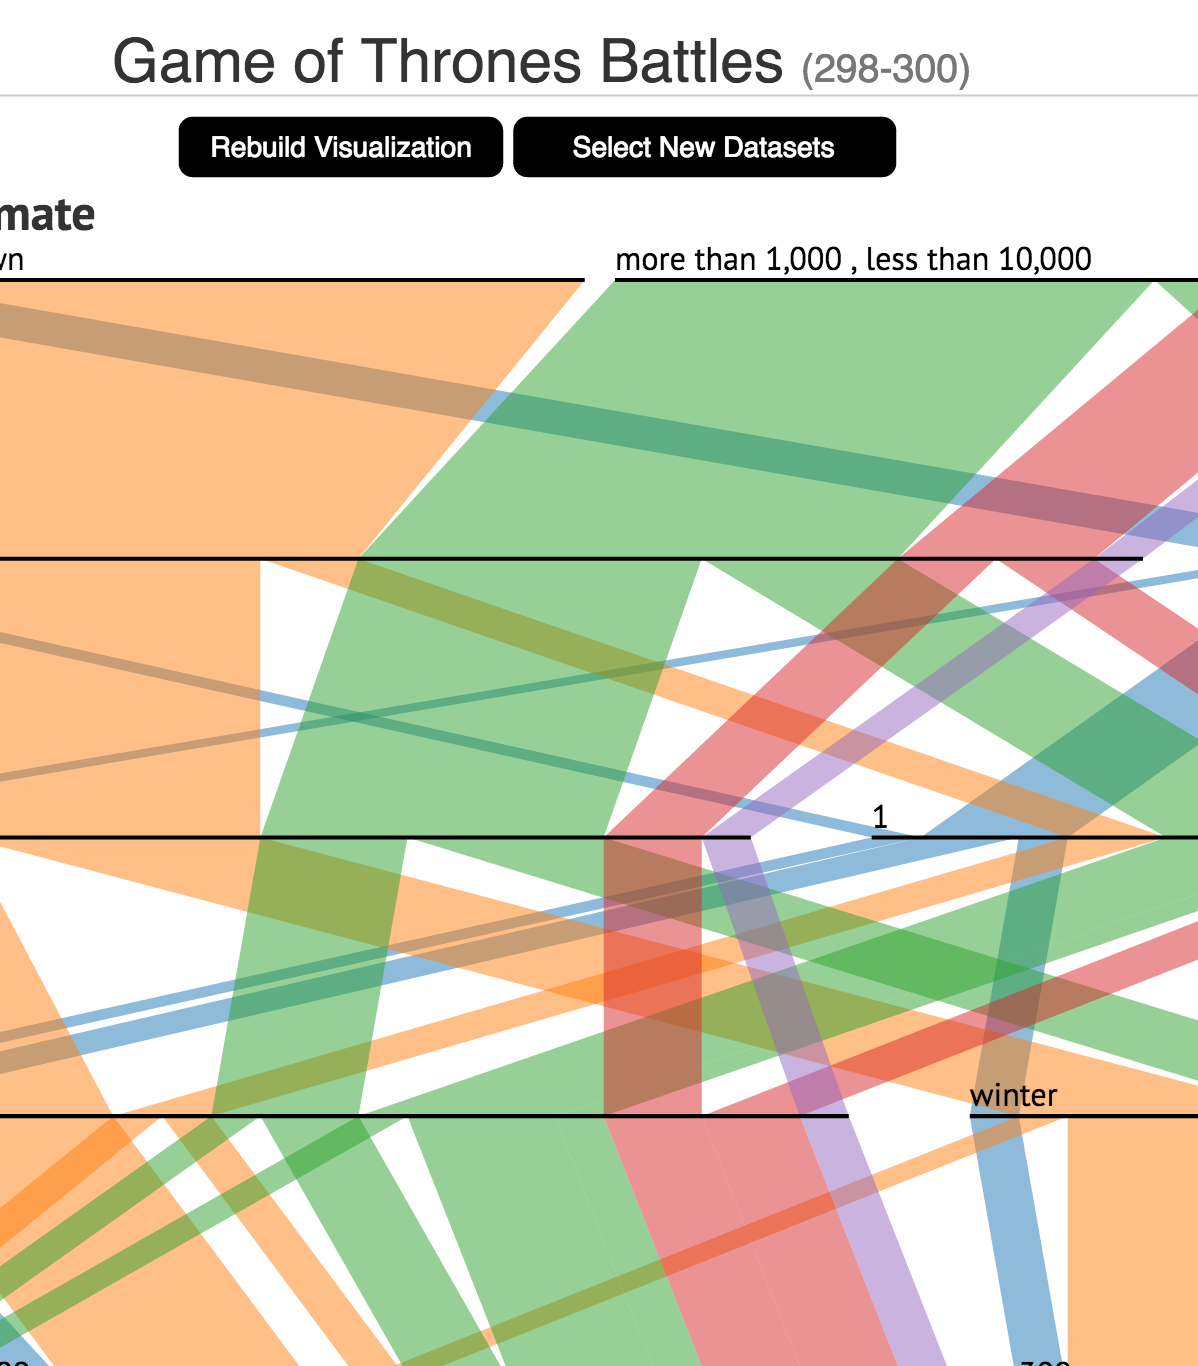
Game of Thrones Parallel Sets
Type: Interative Data Visualization
Tools: D3.js
Built my own implimentation of parallel sets with some interactive draggable features using a dataset of game of thrones battles.
Learn more →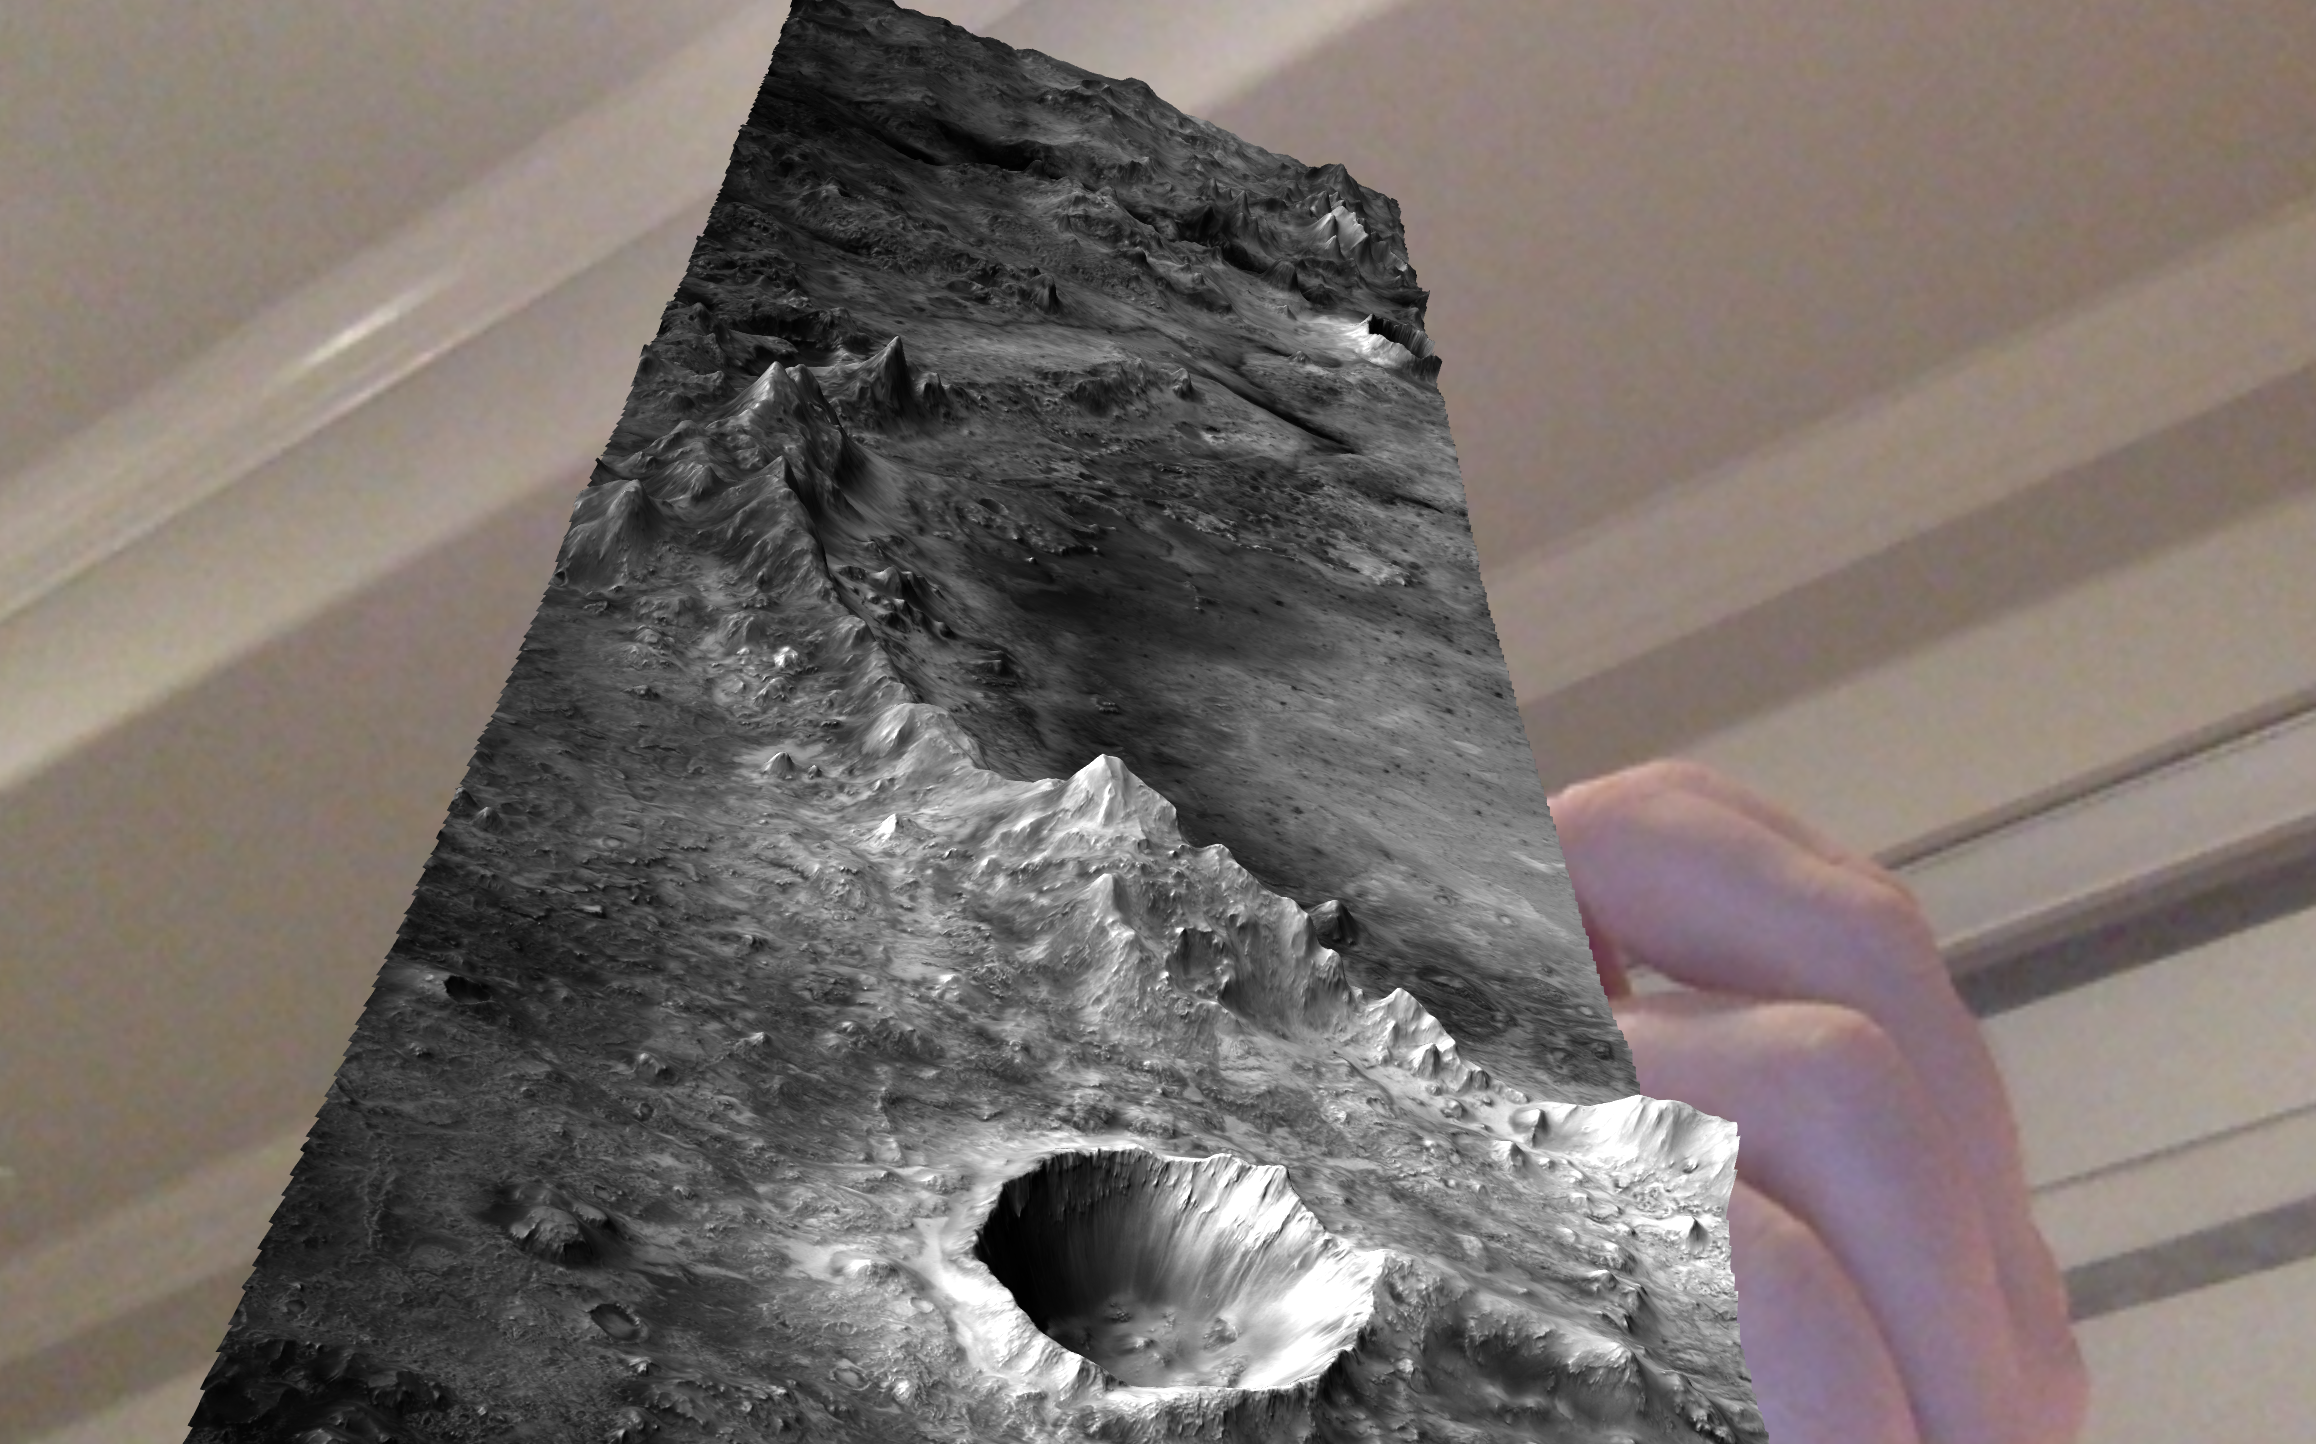
Augmented Reality Business Card
Type: AR Web App
Tools: AR.js, aframe.js, three.js, Artoolkit.js
Made an entirely browser-based (no apps required) augmented reality back for my business card. The 3D model is a topographic model of Jezero Crater on Mars. The previous 3D model was Gale Crater derived from data from ESA's Mars Express mission.
Learn more →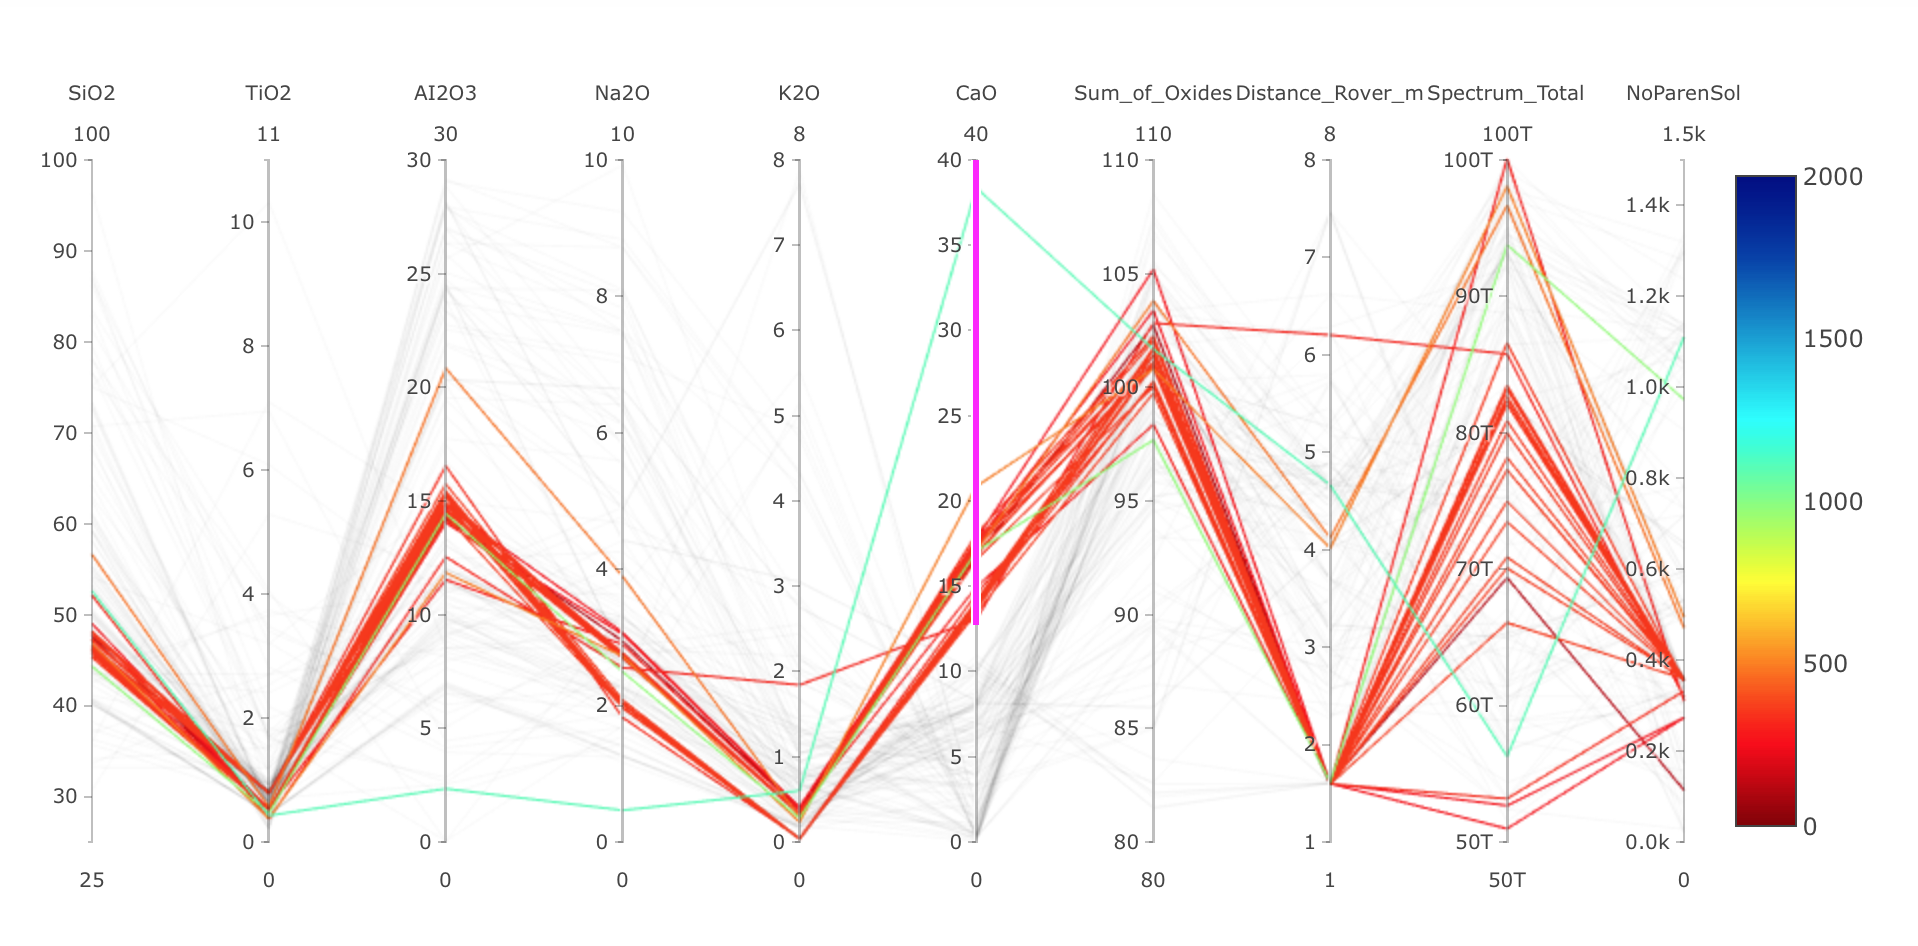
Mars Rover ChemCam Visualizations
Type: Interactive Jupyter Notebook Visualization
Tools: Python, Pandas, Plotly, Jupyter Notebook
A Houston Data Visualization Meetup data jam using major element data from MarsScienceLaboratory (Curiosity Rover) ChemCam rock sample data. This type of data has been visualized statically in the same way for decades. We challenged non-geologists to do new and interactive things with it.
Learn more →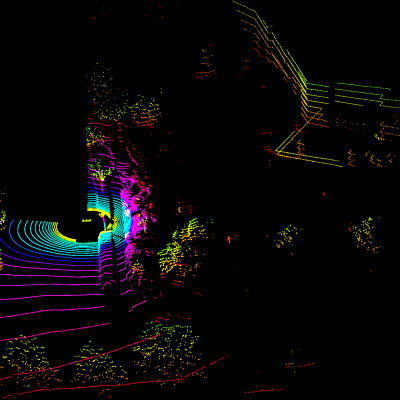
Car Lidar in Three.js
Type: 3D Data Visualization
Tools: Three.js
Quick side project to visualize car-based LIDAR data using three.js. Very different than the plane-acquired LIDAR datasets I'm more familiar with from GIS (geographic information systems) world. Easier tooling choice would be Potree as its purpose built for LIDAR but wanted to see if possible to work in three.js.
Learn more →