- Published on
Half-baked thoughts on predicting chronostratigraphic surfaces
EDIT: I continued work on these ideas and released a proof-of-concept for predicting chronostratigraphic well log tops called, Predictatops. More details in this blog post.
Table of Contents
Why make half-baked thoughts public? / Disclaimer
I think predicting stratigraphic surfaces in well logs programmatically is a really interesting, if difficult, problem. I've been working on it from time to time over the last few months as a side project after starting it as a hackathon project. A person I know from the twitter-verse is going to this years version of the same AAPG hackathon and wanted to work on the same problem. He contacted me for suggestions. Although I've gotten some encouraging results, there are lots of paths to improvement that have not been to be tested. That means I have a lot of interesting but very likely wrong ideas in my head, which I'm sharing below. I'm also coming of 13 hours of jet lag. I apologize in advance for everything being a bulleted list and maybe not entirely making sense at times. Good luck!
Some Basics for the non-geologists:
What are well logs?
Well logs are basically point measurements taken at set intervals along a well bore drilled into the earth. Typically, a half a foot is a common interval. These measurements are often visualized as line graphs tilted on their side. Depth is the y axis. Measurement of some physical property is the x axis. The number of different types of measurements, well curves, in a well varies. Typically, it might be three to twelve different curves. Wikipedia has some good general information on well logs.
What type of correlation?
Geologists like to break things into formations and units. Basically, to say this bit of well A is the same as well B. Often, the implication is the rocks in unit A in one well are the same age as rocks in unit A in another well, hence chronostratigraphic correlation.
Due to the fact that well logs don't directly measure age, chronostratigraphic correlations are interpretations by a geologist based on what they think formation A and formation B should look like.
If you're not doing chronostratigraphic correlation, you're likely doing lithostratigraphic correlation. In this type of correlation, you just correlating rocks with similar lithology. Sands to sands. Shales to Shales.
Lithostratigraphic correlation has an advantage in being done programmatically in that it doesn't attempt to make very long correlations and the variance that has to be dealt with is smaller. For this reason, machine-learning or programmatic lithostratigraphic correlation between only two wells is possible, and probably preferred, where as you need a larger population of wells to do chronostratigraphic correlation using machine-learning.
A good example of programmatic lithostratigraphic correlation is the CORRELATOR Fortran-based software out of the Kansas Geological Survey.
Potential Hypotheses and Ideas for Framimg the Problem
Geologic Truths that would be nice to include some how in any sort of automated approach?
- Shales are more important than sands for correlating.
- Surfaces have appearances than change both gradually over a region and over very short distances.
- Usually if certain primary characteristics of a surface are not locally present, other secondary characteristics will still be present.
- Very large changes in characteristics are unlikely to only appear once. They are commonly caused by salt dissolution, faults, or channelized erosion, which means their distribution may be localized but unlikely to just one well.
Big simplistic concepts I like
- If we think carefully about the types of observations geologists make while looking at logs and correlating them, we can come up with good ways to mimic those observations with quantitative programmatically generated features for machine-learning.
- Class expression (whether or not a point is the surface in question) is highly variable. Your program should be able to deal with high variance and a some noise.
Big simplistic concepts I don't like
- The idea that applying a single fancy math technique to raw data will work, because there is an underlying mathematical pattern to well log curves that makes them predictable (This is typically said by physicist or physics-inclined and really could be any domain they stumble into).
- Fractals (just because you can squint and see them everywhere doesn't mean they are useful for prediction).
Parts I'm very certain about
- To predict whether or not a point in a well is a specific time surface, you need to leverage information about that point, the points above and below it, the transition of points above and below it, points in neighboring wells, and information about known surfaces both locally and regionally - all in regards to that point in question that you are trying to determine whether or not is ___ chronostratigraphic surface.
Thoughts I like but might be wrong
- The need for many engineered features (and more than I have right now 40-60 features in total)
- Tree-based machine-learning algorithms, like random forests or xgboost, are a way to go both as they are more self-explanatory (not a black box as you can see all the decision points) and deal well with spatial differences in class characteristics.
- The pearson correlation & shale character based approach for programmatic lithostratigraphic correlation taken by the CORRELATOR software can be used in a machine-learning based approach as additional features.
Thoughts I give less weights but might be useful
- Ideally, you'd leverage as many logs as possible but should start with Gamma-ray.
- Learning more and more towards some sort of multi-step approach in which a first round of prediction is done and then leveraged in second round.
- Leveraging aggregate and map-based information on groupings from known wells and applying those groupings manually is a good idea.
- Doing a two step machine-learning process where first step generates a class of unit name for each point and second step predicts a probability of each of the points being the pick in question. This might deal with some of the false positives and better take advantage of the some of the higher certainty information away from the point in question or away from the actual pick position.
- Wavelet transform and other approaches have been useful in ECG waveform classification in the medical field. Although, I think these approaches won't be as useful in well log correlation due to the wide variance in surface character, there might be a way to use them for local comparison of 2-5 wells where appearances are more likely to be similar, though this risks becoming strongly lithostratigraphic.
Things I wonder about
- What is the best way to included information about the the sequence of log curve data significantly above or below the point in question?
- What would be the best way to combine LSTM (long-short term memory) into the process?
- Is LSTM even needed or can that information be included in other ways?
- What are other ways?
- What other features can I create from the well curve data?
- Normalization:
- To what degree do I need to normalize both raw and calculated data?
- How much could this be throwing off the results?
- What would be the best way to go about doing that given the raw data isn't collected the same way every time?
My current work in this problem space
Good Reads
- CORRELATOR User's Manual : Lithostratigraphic Correlation in Fortran
- "Using the Scattering Transform to Predict Stratigraphic Units from Well Logs", by Ben Bougher, Felix J. Herrmann
Possible algorithms
I like tree-based algorithms for this problem it seems like they would deal well with class characteristics changing spatially and there are ways to visualizing the resulting leaves of a decision tree, which eliminates a lot of the black-box problem some people have with machine-learning. Additionally, if you can see into the algorithm decision making process, it might inspire creation of additional features or even new ways of looking at the geology.
- Extreme boosted trees or XGBoost
- Random Forest
- Some combination of LSTM and random forest.... not sure the best way to combine? Do LTSM only locally?
Notes on setting up the problem
- If you judge success by trying to predict the formation of every point, you'll appear to get decent results pretty easily. What you should really be going for is the picks. Error should not be % of formation points predicted successfully but rather the average error between predicted pick depth and actual pick depth.
- There are 3-4 wells in the Mannville dataset that might give you problems with certain types of feature creation as there is "bad" or "odd" data in them.
- Always useful to look at the actual wells before, during, and after trying to do machine-learning projects.
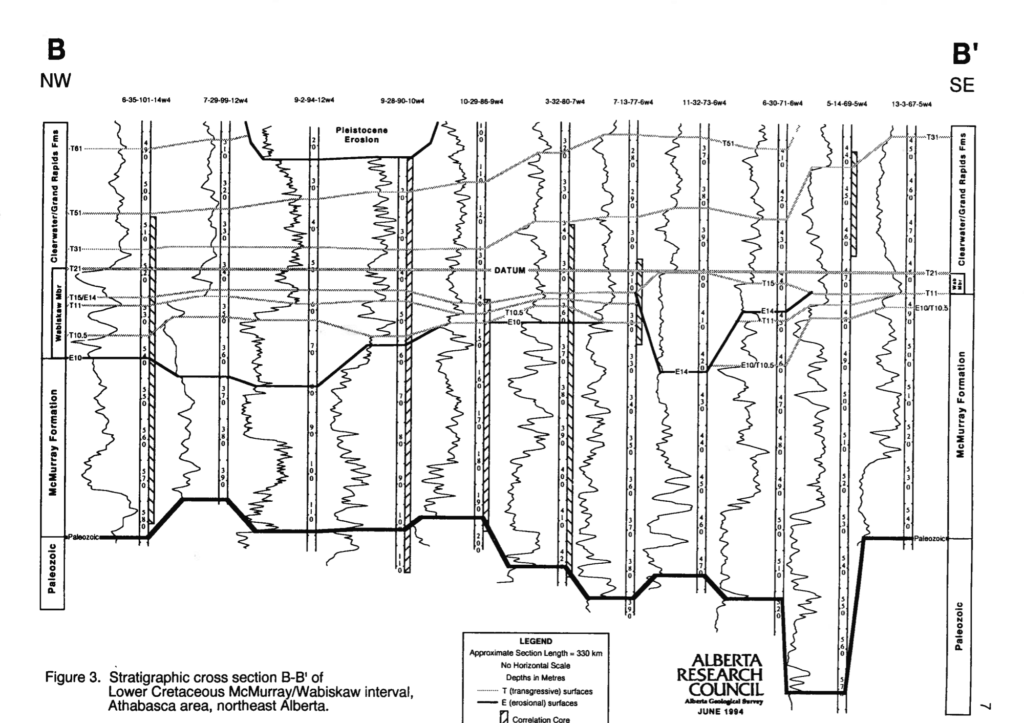 A cross-section showing different tops in different wells. Vertical curvy lines are gamma-ray well log curves. Alberta Geological Survey Open File Report 1994-14. Cross-section B to B'.
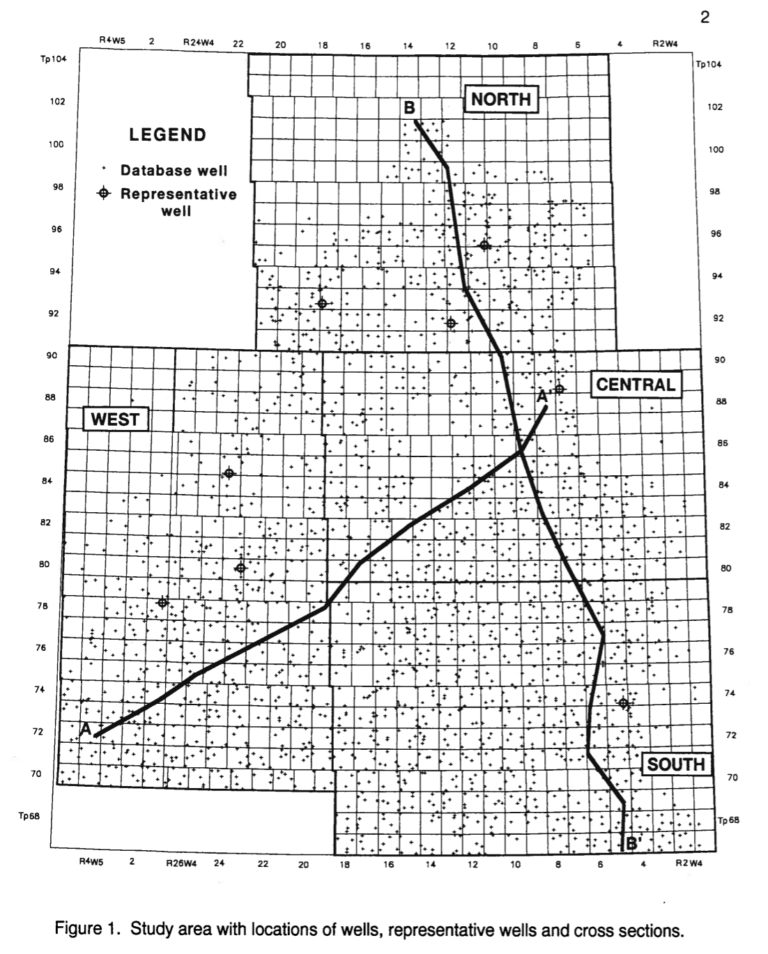 Map of Mannville wells in the Alberta Geological Survey open file report 1994-14 that are used in the project I’m doing at the github link.
Basic Features
- Raw values at a depth in a well & normalized values
- For different windows above, below, around a point in question:
- average, sum, max, min, max/min
- ranges
- slopes
- variance
- slope variance
- same as everything above but for higher or lower ___ number of points
- Thickness of unit in question in nearby wells
- Where surface would be in well in question if thickness didn't change from nearby well
- All characteristics from 1 & 2 in nearby wells with known surfaces
Hackathon-sized sub-problems to tackle
- See number 2 in section directly above.
- See number 3 in section directly above.
- What's the best way to identify sub-regional trends like thickness, background shale value, chance of confusing erosion surfaces, etc. that might correlate with surface appearance changes and be identified as within certain spatial areas from known wells.
- CORRELATOR used a small expert knowledge system with their more programmatic work. Can something similar be done here?
- What are the different ways to visualize error in pick prediction or multiple different potential pick positions based on probability?
- Optimize the feature creation code here: MannvilleGroup_Strat_Hackathon
- In the mannville dataset, there are a large number of wells with facies identified as well. Can the distribution of facies be used as another feature? What would it add?
- Re-build at least part of CORRELATOR in python, instead of Fortran, and then use comparisons of neighbor wells for features. Alternatively, use a completely different correlation coefficient approach that does something roughly similar (but easier) that could at least provide some ballpark constraints on where the other features should be looking.
- Can we create an expert system to quantitatively identify and describe circumstances where lithostratigraphy is likely fine or likely not fine?
- Prograding parasquences?
- Transgressive surface hard grounds?